How Lab Command is built.
Lab Command separates the source logic, the operating records and the instructional story — an evidence system rather than a collection of disconnected cases. That separation keeps figures consistent across dashboards and lets evidence be reused without duplication.
Five layers, one set of records.
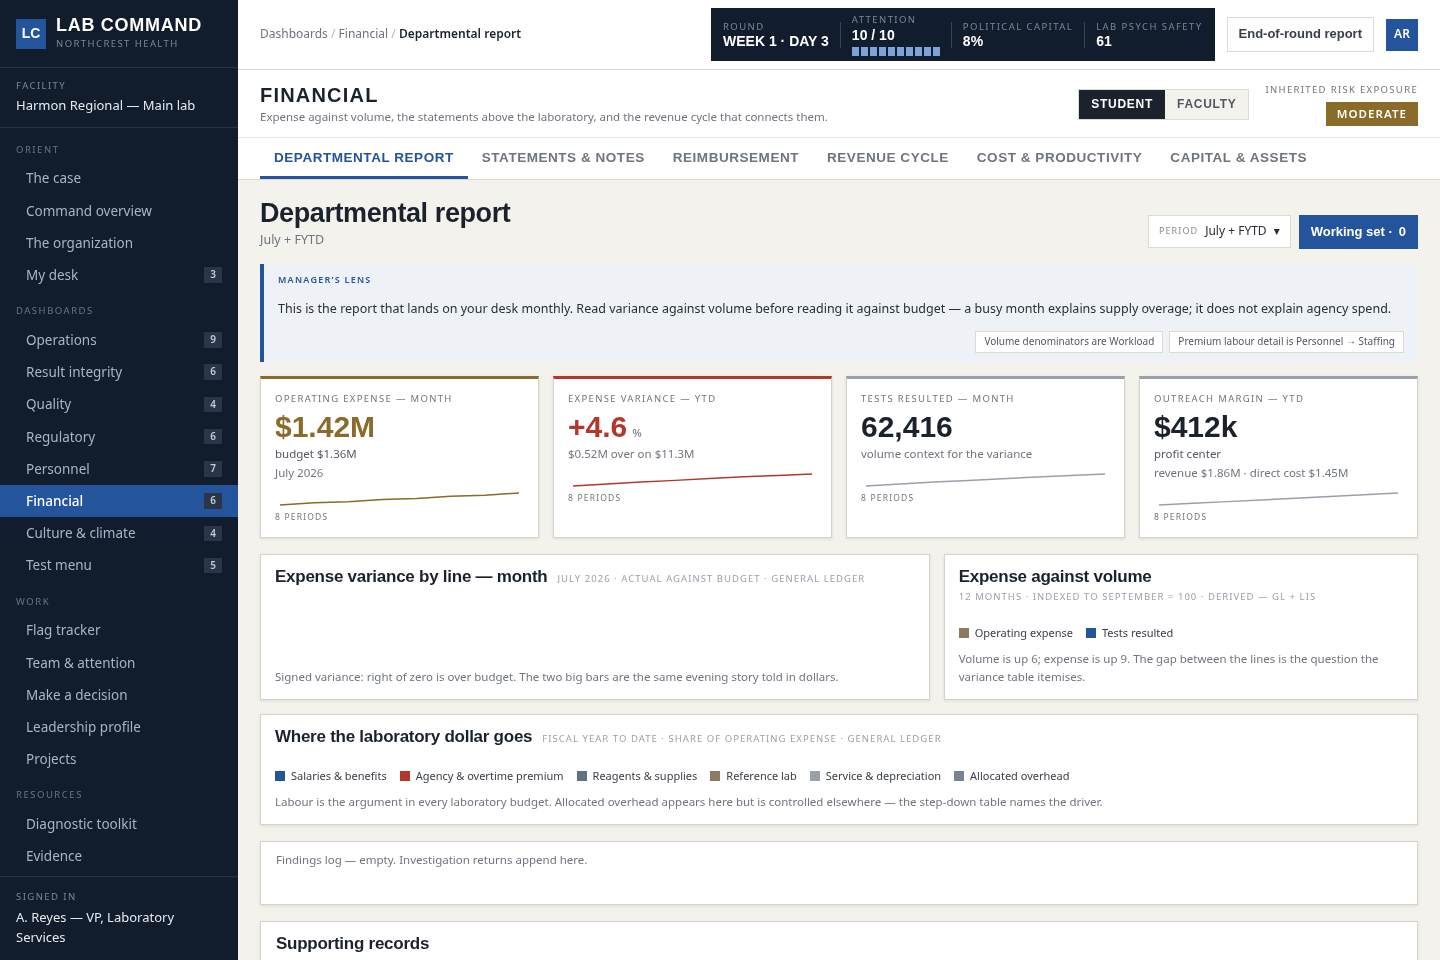
Every figure a learner reads is computed from records underneath it, which is why the numbers still agree after they filter, scope and export them.
Evidence sources
Public regulatory, financial, workforce and scholarly material.
Calibration
Plausible ranges for a 400-bed acute-care hospital laboratory.
Operational records
Row-level orders, specimens, results, staffing, devices, inventory, critical communications, microbiology accessions, transfusion activity, referrals, POCT events and capacity constraints.
Dashboards
Every displayed figure computed from those records, never authored.
Cases & consequences
Decision logic that writes back into the records for later rounds.
What informs what.
Harmon Regional is fictional and the row-level records are simulated. The assumptions and calibration are grounded in real laboratory management evidence.
Publicly available information from agencies and accrediting organizations is used as source material. Their inclusion does not imply endorsement, review or sponsorship of Lab Command.
To keep row-level analysis practical for learners and browser-based delivery, downloadable transaction datasets use a representative 25% Baseline Operational Sample of Harmon Regional's modeled weekly activity. The sample preserves the relationships needed for analysis; full-population estimates are used where the analytical context requires them.
Interested in studying laboratory management?
Lab Command is not currently collecting research data from users. It does create a platform for scholarship on experiential management education, data literacy, psychological safety, team decision-making and transfer into practice.